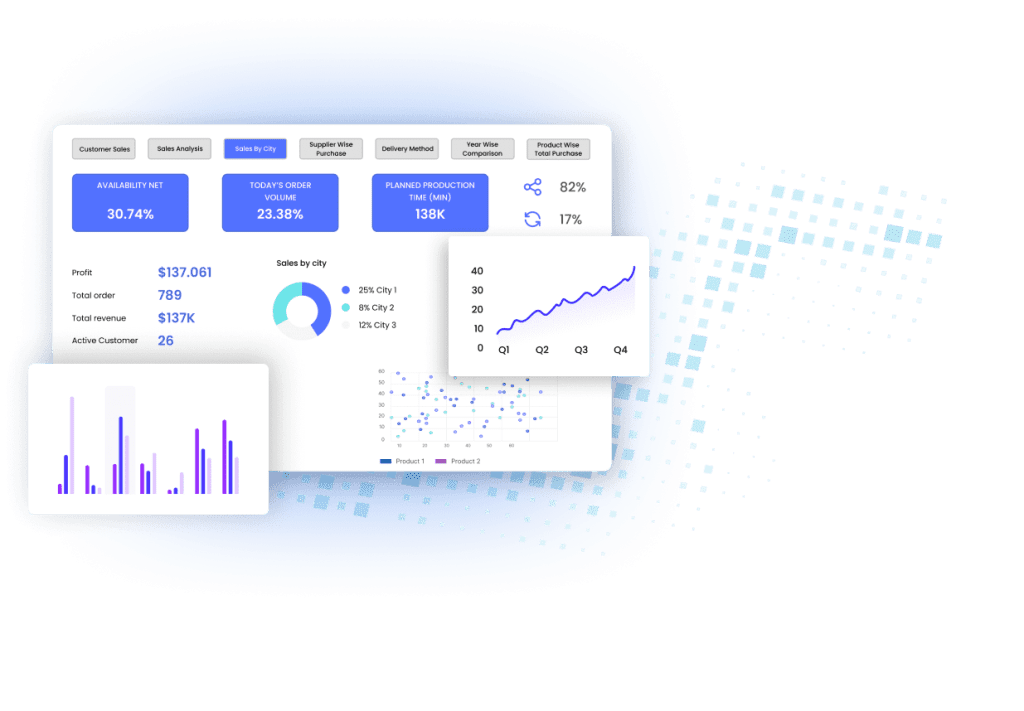
Sales Dashboard for Business Teams
Advanced analytical reporting solution that seamlessly integrates your sales data into MS Power BI and provides you with accurate and actionable sales reports.

Trusted by Top Industry Players
Gain actionable insights from your sales data
Optimise Sales Performance with Microsoft Power BI
Challenges in implementing Sales Processes in reporting
No attention to detail regarding what's driving the results.
Unable to create variance analysis without shifting data to MS excel.
A general lack of data visualization makes trends and relative scales harder to identify.
Summary-level reports do not provide details on underlying transactions.
Too many professionals manage the reports at once.
Generating clear reporting hierarchies that group up non-relevant information becomes difficult.
Requires IT support
Finance Analytics Solutions by DataToBiz
Balance Sheet Analysis
Detailed analysis of net working capital, accounts payable and accounts receivable, inventory and fixed assets over the balance sheet.
Cashflow Statement
Detailed display of your cash management performance, plus account balance movements analysis.
Profit & Loss Reports
Examine revenue, margins, operating expenses, and profits in detail for your P&L statement. With a simple slicer selection, switch to a "percentage of revenue" view.
Sales Analytics Solutions by DataToBiz
Customer Sales Analysis
Maximize profits by unlocking the buying behavior of your customers with our advanced sales analysis.
Comparative Analysis
Gain a competitive edge and stay ahead of the game with our powerful comparative analytics.
Geospatial Analysis
Discover new opportunities and make informed decisions by visualizing accurate location-based insights.
Why Choose DataToBiz?
- One-stop solution for all your Sales reporting necessities.
- Multiple sources of data under one roof.
- Complete cloud-based interface.
- Can be tailored according to your customers’ needs.
- Understands and seamlessly integrates with your business model.
- Contains and engages with other data sources than finance ERP.
Step ahead with your Finance Data
◘ Cash Flow, Balance Sheet, Profit & Loss
◘ Point in Period or Time
◘ Trends, Scale & Context visualization
◘ Explore liquidity, working capital, debt, profitability, and capital.
◘ Gain insight into subject matter reporting, including working capital, AP and AR, inventory, fixed assets, cash management, revenue, margins, operating expenses, and profits.
◘ Comprehensive understanding of your performance.
◘ Custom period/version/dimension comparisons of financial statements.
◘ Variance analysis and decomposition to gain insights into your financial performance.
◘ Drill down to the underlying transactions.
Visualize your Sales Data in Power BI
Schedule a demo session or talk to a BI expert
How does DataToBiz’s Sales reporting solution deliver?
- Minimal IT support/configuration involved.
- Understand your business value.
- Fully Cloud-Based software
- Intuitive and easy-to-learn algorithm.
- Affordable subscription Plan.
Get In Touch
We will call or email you ASAP to discuss your project and provide you with a free no obligation quote.
We take privacy seriously. We will never sell your email address to any 3rd party or send you nasty spam.