Automating Data Processing and Centralized Reporting for the Financial Services Industry

Our Client

  • A leading consulting and advisory firm, founded in 2014, composing industry experts with senior leadership experience in global financial and payments organizations.
  • Based across Europe, Asia Pacific, the Middle East, and Africa, the firm offers consultancy, advisory, management services, and education to clients like issuers, fintechs, and payment processors.
  • The firm is well-known for its deep domain expertise, flexible approach, and strong collaboration with clients in the financial and payments sectors.

Problem Statement

During discussions between our experts and the client, several real-time challenges were brought to light. The client was dealing with issues that were directly affecting their operational efficiency and decision-making capabilities. These challenges were as follows:
    • The client highlighted ongoing difficulties in processing and converting large volumes of unstructured data, making it nearly impossible to extract meaningful insights that were critical for business decisions.

    • Manual data handling had become a major bottleneck, consuming excessive time and leading to frequent errors, which were slowing down workflows and hindering scalability

    • In the meetings, it became clear that managing invoice and card-related data was inefficient without a centralized dashboard, leaving the client with disjointed reporting and a lack of cohesive analysis.

    • The client raised concerns about not being able to track data in real-time, which was delaying important decision-making and impacting their ability to act swiftly on emerging trends.

    • They also questioned the reliability of their current systems, as the lack of automation and integration was causing frequent delays and limiting their ability to make timely, data-backed decisions.

Our Solution

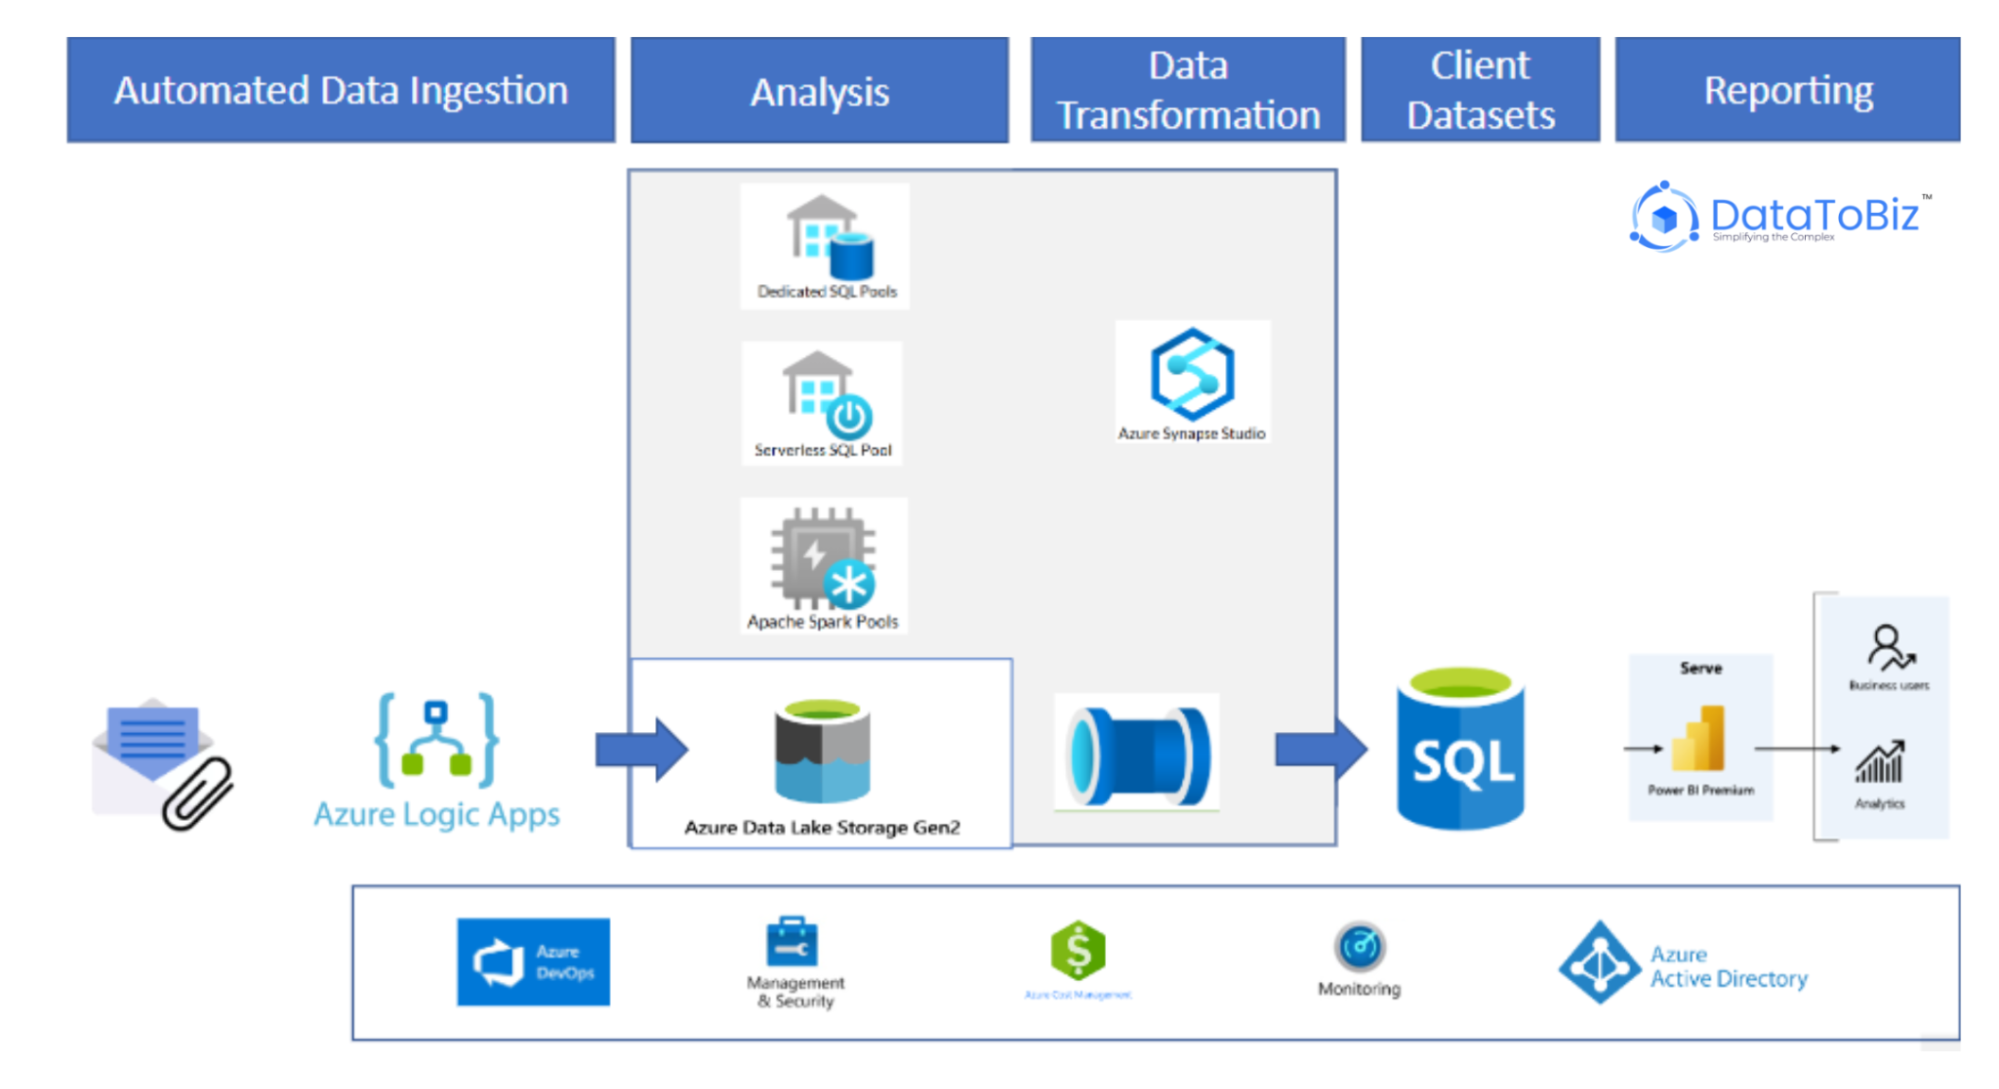
Our solution focused on building an integrated architecture that would not only enhance data processing but also ensure scalability and real-time insights.

  • Automated Data Pipeline:  We developed an Azure function-based pipeline to automate the process of converting unstructured data into a structured format. This pipeline was integrated with Azure SQL Database, allowing real-time data storage and easy access for analysis.
  • Centralized Power BI Dashboard:  Our developers created a custom Power BI dashboard to centralize invoice and card volumetric data. This dashboard provided dynamic, interactive charts and filters, giving the client an easy-to-navigate tool for analyzing various data points.

  • Performance Optimization: To ensure the system could handle large datasets, we optimized data processing workflows. We automated the ingestion, transformation, and visualization of data to improve both performance and scalability, reducing the manual workload.

  • Data Integration: We ensured that the Power BI dashboard would be continuously updated with the latest data from the Azure SQL Database through scheduled refreshes, providing the client with timely insights for faster decisions.

  • Improved System Reliability: By automating the entire data pipeline and visualization process, we drastically reduced the client’s dependency on manual interventions, improving the overall reliability of their system.

Facing a similar challenge in your business?

Technical Architecture

We designed a simplified yet robust technology architecture to streamline data processing and ensure scalability later on. Here’s how we implemented it:


Data Schema Development: We analyzed the client’s existing Excel models and developed a comprehensive data schema to support Power BI reporting and efficient data warehousing.
Data Ingestion: Azure Logic Apps automated the flow of data from Excel or CSV files into the system, streamlining data collection.
Data Transformation: Azure Data Factory managed the extraction, transformation, and loading (ETL) of data from the Data Lake into Azure SQL Database, ensuring alignment with the new schema.
Power BI Reporting: We replicated the client’s Excel reports in Power BI, allowing real-time tracking of key metrics and trends with interactive visualizations.
Secure Access: Azure Active Directory (AAD) was implemented to ensure secure user authentication, limiting access to authorized personnel.
Performance Monitoring: Azure Monitor and Cost Management tools were used to track system performance and resource usage, ensuring efficiency and cost-effectiveness.

Business Impact

    • We automated the conversion of unstructured data into a structured format using Azure functions, reducing manual processing from 40 hours to just 4 hours per week.
    • Integration with Azure SQL Database ensured near-instant access to data, cutting down retrieval time from 30 minutes to under 10 minutes, allowing for quicker decision-making across stakeholders.

    • All invoice and card data is now visualized in a centralized dashboard(with better readability), cutting reporting time from 2 days to just a few hours due to dynamic, user-friendly visualizations.

    • The new dashboard design led to a 90% increase in user satisfaction, with users praising its intuitive layout and time-saving features, reducing reporting-related queries by ½.

With the automated data pipeline and custom Power BI dashboard in place, our client now has real-time insights at their fingertips. Manual work is a thing of the past, and reporting is faster and smoother than ever in the enterprise. The implemented solutions didn’t just solve their current challenges—it set them up for future growth and agility in a competitive services space.

Looking for a Similar Solution?
We Can Help

DMCA.com Protection Status

Get a Free Data Analysis Done!

Need experts help with your data? Drop Your Query And Get a 30 Minutes Consultation at $0.

They have the experience and agility to understand what’s possible and deliver to our expectations.

Drop Your Concern!