Facing Data Paralysis? This Might Save You

Facing Data Paralysis? This Might Save You

Boosting Project Visibility and Reducing Risk with Real Estate Analytics

About Client

  • A prominent Indian real estate developer with over 35 years of expertise in the industry. 
  • Headquartered in Mumbai, the company excels in residential, commercial, and township projects across 10+ major cities. 
  • Known for its innovation, sustainability, and excellence, the organization employs over 2,000 people. It is publicly listed on NSE and BSE and has a market capitalization of approximately ₹30 Crore.

Problem STATEMENT

When sat for the first round of discussion, the client highlighted these issues in their workflow:

Inadequate Tracking of Milestone Performance

The client struggled to track the performance of their collectible base across milestone types such as construction-linked, time-linked, and hybrid milestones. This lack of a robust monitoring system resulted in limited visibility of:

  • Whether payments adhered to predefined schedules.
  • Deviations or delays in payment compliance with milestone plans.

Limited Insight into Shortfalls and Delays

The absence of a system for tracking payment shortfalls and delays against milestones hindered the early identification of risks. Without actionable insights, addressing potential bottlenecks in payment flows was challenging.

Challenges in Financial Planning Due to Dynamic Changes

The inability to dynamically compare baseline financial plans with actual progress posed difficulties in:

  • Adjusting financial strategies effectively.
  • Responding to changes or delays in milestone payment schedules.

Solution

A comprehensive solution was designed and implemented to address the client’s challenges.

Interactive and Dynamic Power BI Dashboard

A user-friendly dashboard was developed to:

  • Seamlessly track collectible performance.
  • Provide real-time updates on milestone progress.

Integration with Financial Planning Processes

The dashboard was designed to align closely with the client’s financial workflows, bridging the gap between milestone tracking and financial strategy adjustments.

High-Level and Granular Insights

The solution catered to stakeholders by offering both:

  • High-level summaries for management.
  • Granular, milestone-specific data for operational teams.

Flexible Baseline Comparisons

Dynamic comparisons between actual performance and baseline plans were integrated, enabling stakeholders to:

  • Identify deviations early.
  • Take corrective actions proactively.

Hierarchical Drill-Down Capabilities

Drill-down features allowed users to:

  • Navigate from overarching trends to specific milestone details.
  • Conduct detailed analysis to uncover root causes.

Technical Implementation

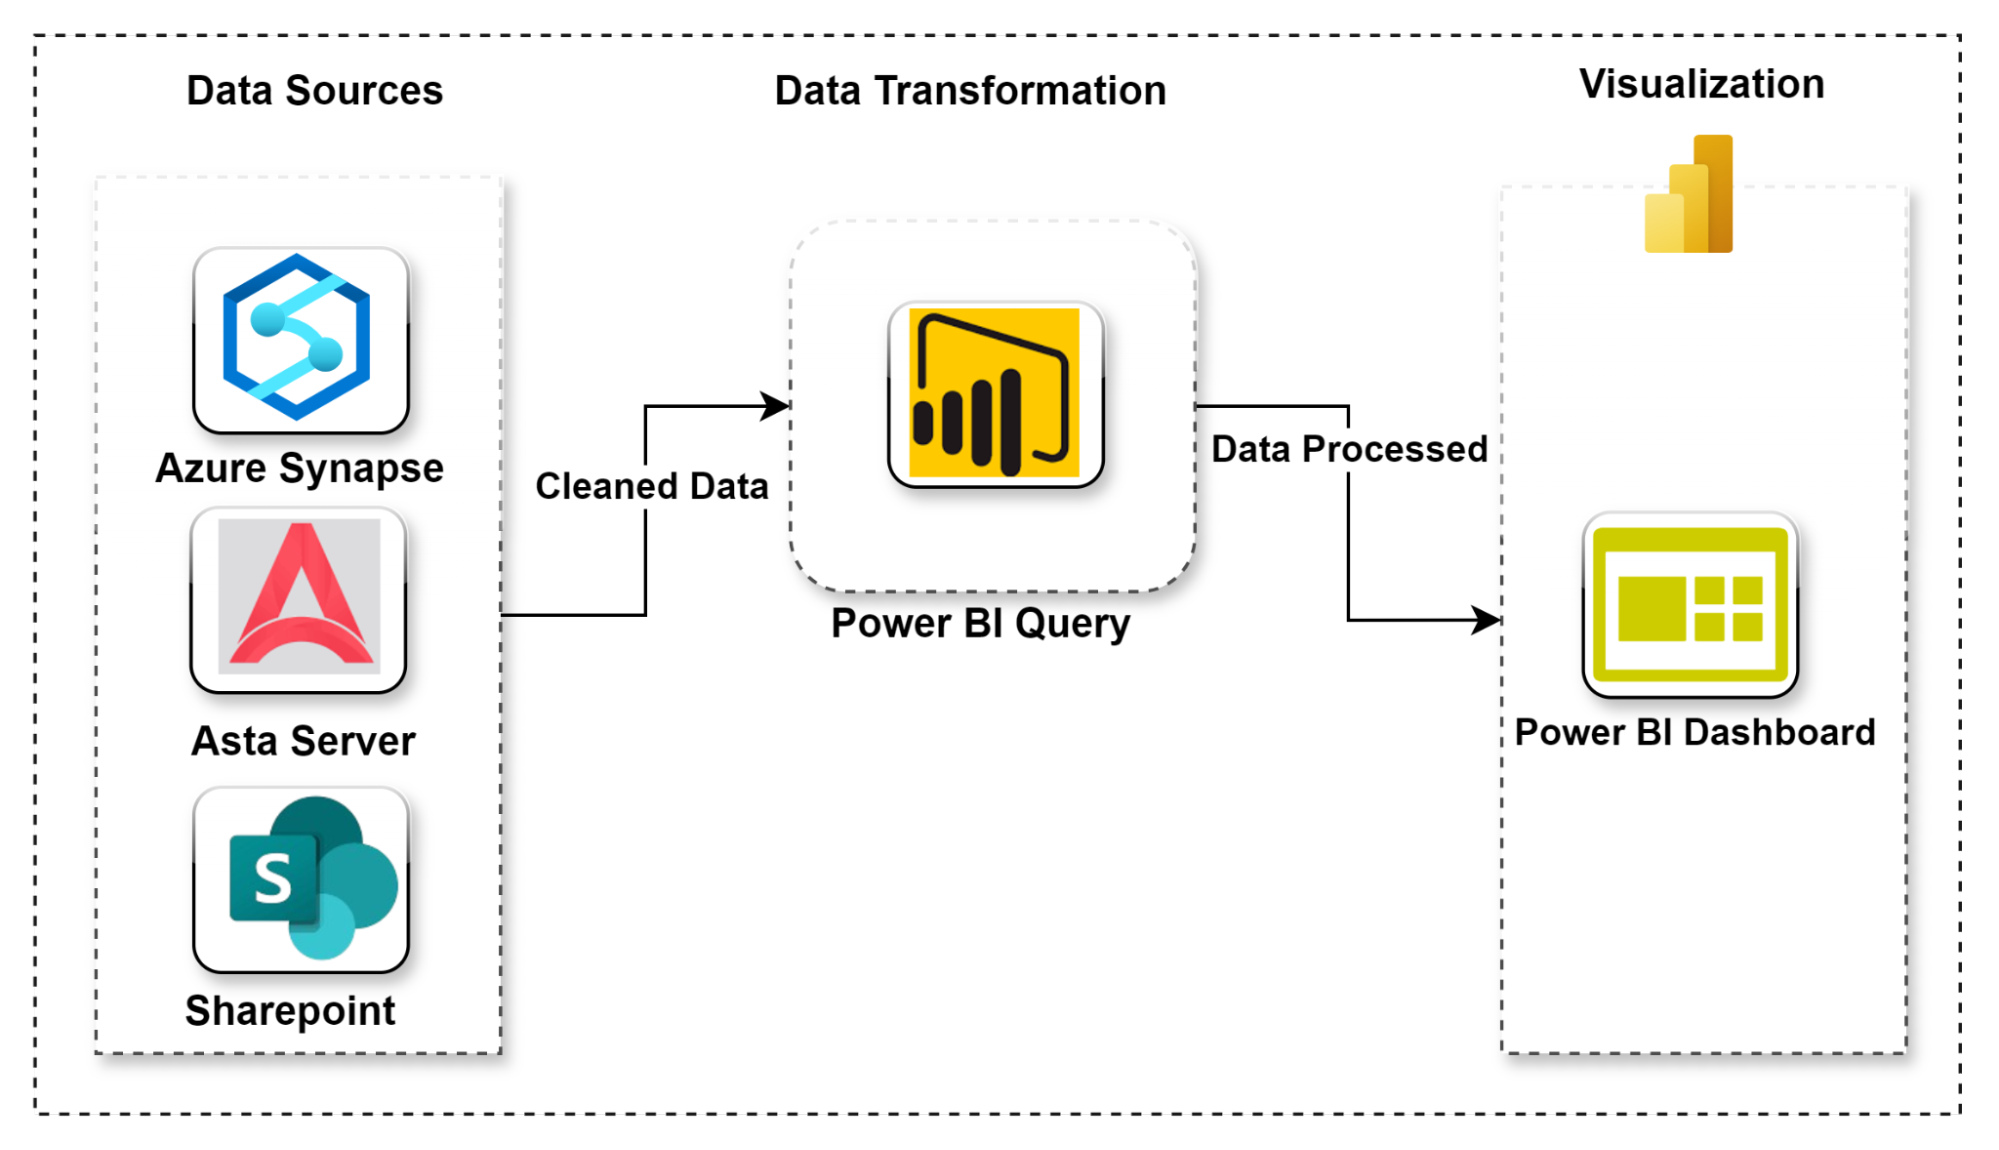
Data Integration from Multiple Sources

  • Azure Synapse for centralized data warehousing.
  • Asta Server for milestone and project management data.
  • SharePoint for document storage and collaboration.

Data Transformation
Data was processed with Power Query to ensure consistency and accuracy before visualization.

Dynamic Logic for Baseline Comparisons
Custom logic was implemented within Power BI for real-time baseline vs. actual performance comparisons.

Advanced Visualization Techniques
Conditional formatting in Power BI dynamically highlighted deviations, shortfalls, and delays.

Scalable Reporting
Dashboards were built with DAX and Power BI tools to support intuitive and scalable reporting for future needs.

Technical Implementation

Business Impact

  • Enhanced Visibility into Performance Monitoring
    Implementing the dashboard significantly improved the client’s ability to monitor collectible performance across various milestones. This increased visibility into project progress by approximately 40%, enabling better tracking and accountability.
  • Improved Data Accuracy and Reliability
    The solution ensured higher data accuracy and consistency by integrating data from Azure Synapse, Asta Server, and SharePoint. Reporting errors and discrepancies were reduced by nearly 30%, enabling more reliable decision-making.
  • Streamlined Operational Efficiency
    Automating milestone tracking and data analysis minimized manual efforts by approximately 50%, freeing up resources and enhancing overall operational efficiency.
  • Proactive Risk Management
    Automated insights provided early detection of delayed milestones and collectible base aging. These capabilities allowed stakeholders to identify potential bottlenecks proactively, improving risk mitigation efforts by approximately 35%.
  • Future-Ready Analytics Architecture
    The solution established a scalable and adaptable analytics foundation, allowing the client to expand capabilities as needed.

The custom BI dashboard transformed the client’s approach to milestone tracking and financial planning. By providing real-time insights, proactive risk management tools, and seamless integration with existing workflows, the solution addressed immediate challenges while laying the foundation for future analytics capabilities.

Industry

Real Estate & Construction

Services Used

Business Intelligence (BI), Data Analytics, Power BI

Region

India

Function/Department

Financial Planning and Analysis (FP&A)

Engagement Model

End to End Project Lifecycle Management

Drop Your Business Concern

Briefly describe the challenges you’re facing, and we’ll offer relevant insights, resources, or a quote.

Ankush

Business Development Head
Discussing Tailored Business Solutions

DMCA.com Protection Status