Revamping Ayurveda Wellness Brand’s Investment Strategy with Data Insights

About Client

  • A leading Ayurvedic wellness and beauty specializing in skin and hair care products made from plant-based ingredients. 
  • With a dedicated team of 100+ employees, they offer products free from sulfates, harsh foaming agents, and parabens. Their formulations, which include natural ingredients like milk, rose water, yogurt, and lemon juice, provide a unique skincare experience rooted in Ayurveda and aromatherapy principles.

Problem STATEMENT

The company highlighted multiple challenges during our discussions, particularly around securing funding and analyzing customer data effectively:

Challenges in Securing Funding

The company struggled to present a compelling case to investors due to a limited understanding of its customer base. This lack of comprehensive data made it difficult to showcase their market potential.

Development of Robust Data Solutions

The company’s existing data was fragmented, limiting its ability to understand the broader customer demographics. This hindered their ability to attract necessary investments.

Creation of Investor Dashboards

The client lacked a data-driven, visual storytelling approach for investor pitches. Without actionable insights, it was challenging to build investor confidence.

Addressing Customer Analysis Challenges

The company relied on basic open-source data and third-party tools, which did not provide a comprehensive view of their customer behavior and preferences.

Solution

After discussing the challenges, our major scope of work focused on a comprehensive data analysis and reporting initiative to address the client’s funding challenges and enhance customer insights. Key steps taken by our were:

Data Aggregation and Development

Our experts implemented advanced data aggregation techniques to create a comprehensive dataset, capturing a wider demographic of the client’s customer base from sources like Shopify and third-party tools.

Power BI Dashboard Creation

Our assigned developers designed interactive Power BI dashboards that effectively visualized key metrics, providing clear insights into customer behavior for investor presentations.

Enhanced Customer Analysis

The company’s customer analysis methods were refined, utilizing accurate, actionable data that identified key trends and informed their strategic decisions.

Training and Support

We trained the client’s team on utilizing Power BI dashboards and data analysis tools, empowering them to make data-driven strategies.

Investor Engagement

The dashboards developed were used during investor discussions, showcasing a deep understanding of the market and enhancing investor confidence.

Technical Architecture

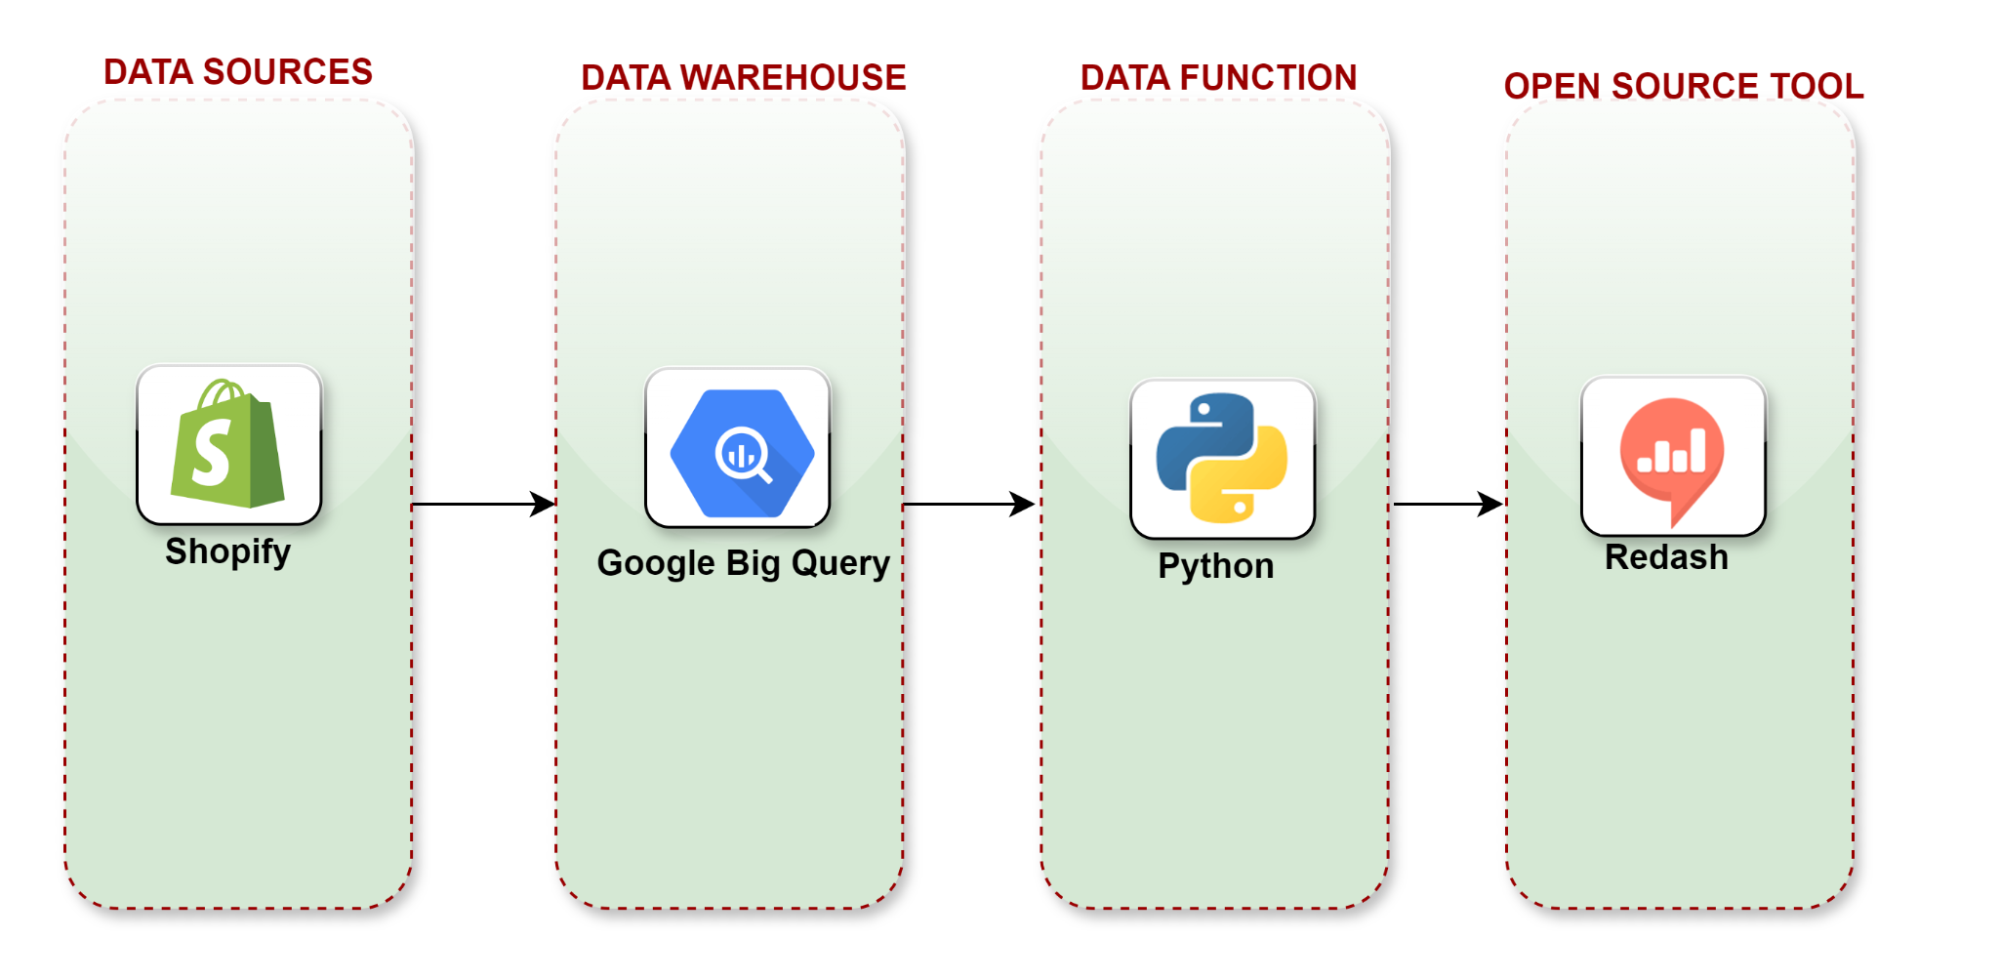
Implementation 1:

  • Extract Data from Shopify:
    Shopify’s REST or GraphQL API was used to extract order, product, and customer data programmatically.
  • Load Data into Google BigQuery:
    Data was uploaded to Google Cloud Storage and processed in BigQuery using the BigQuery Python client.
  • Data Processing and Analysis in Python:
    Python’s BigQuery client and Pandas were employed for transforming and analyzing data.
  • Visualize Data in Redash:
    Redash was used to query and visualize data in a user-friendly dashboard.
  • Automate and Schedule Reports:
    Google Cloud Scheduler automated data extraction, loading, and report generation.

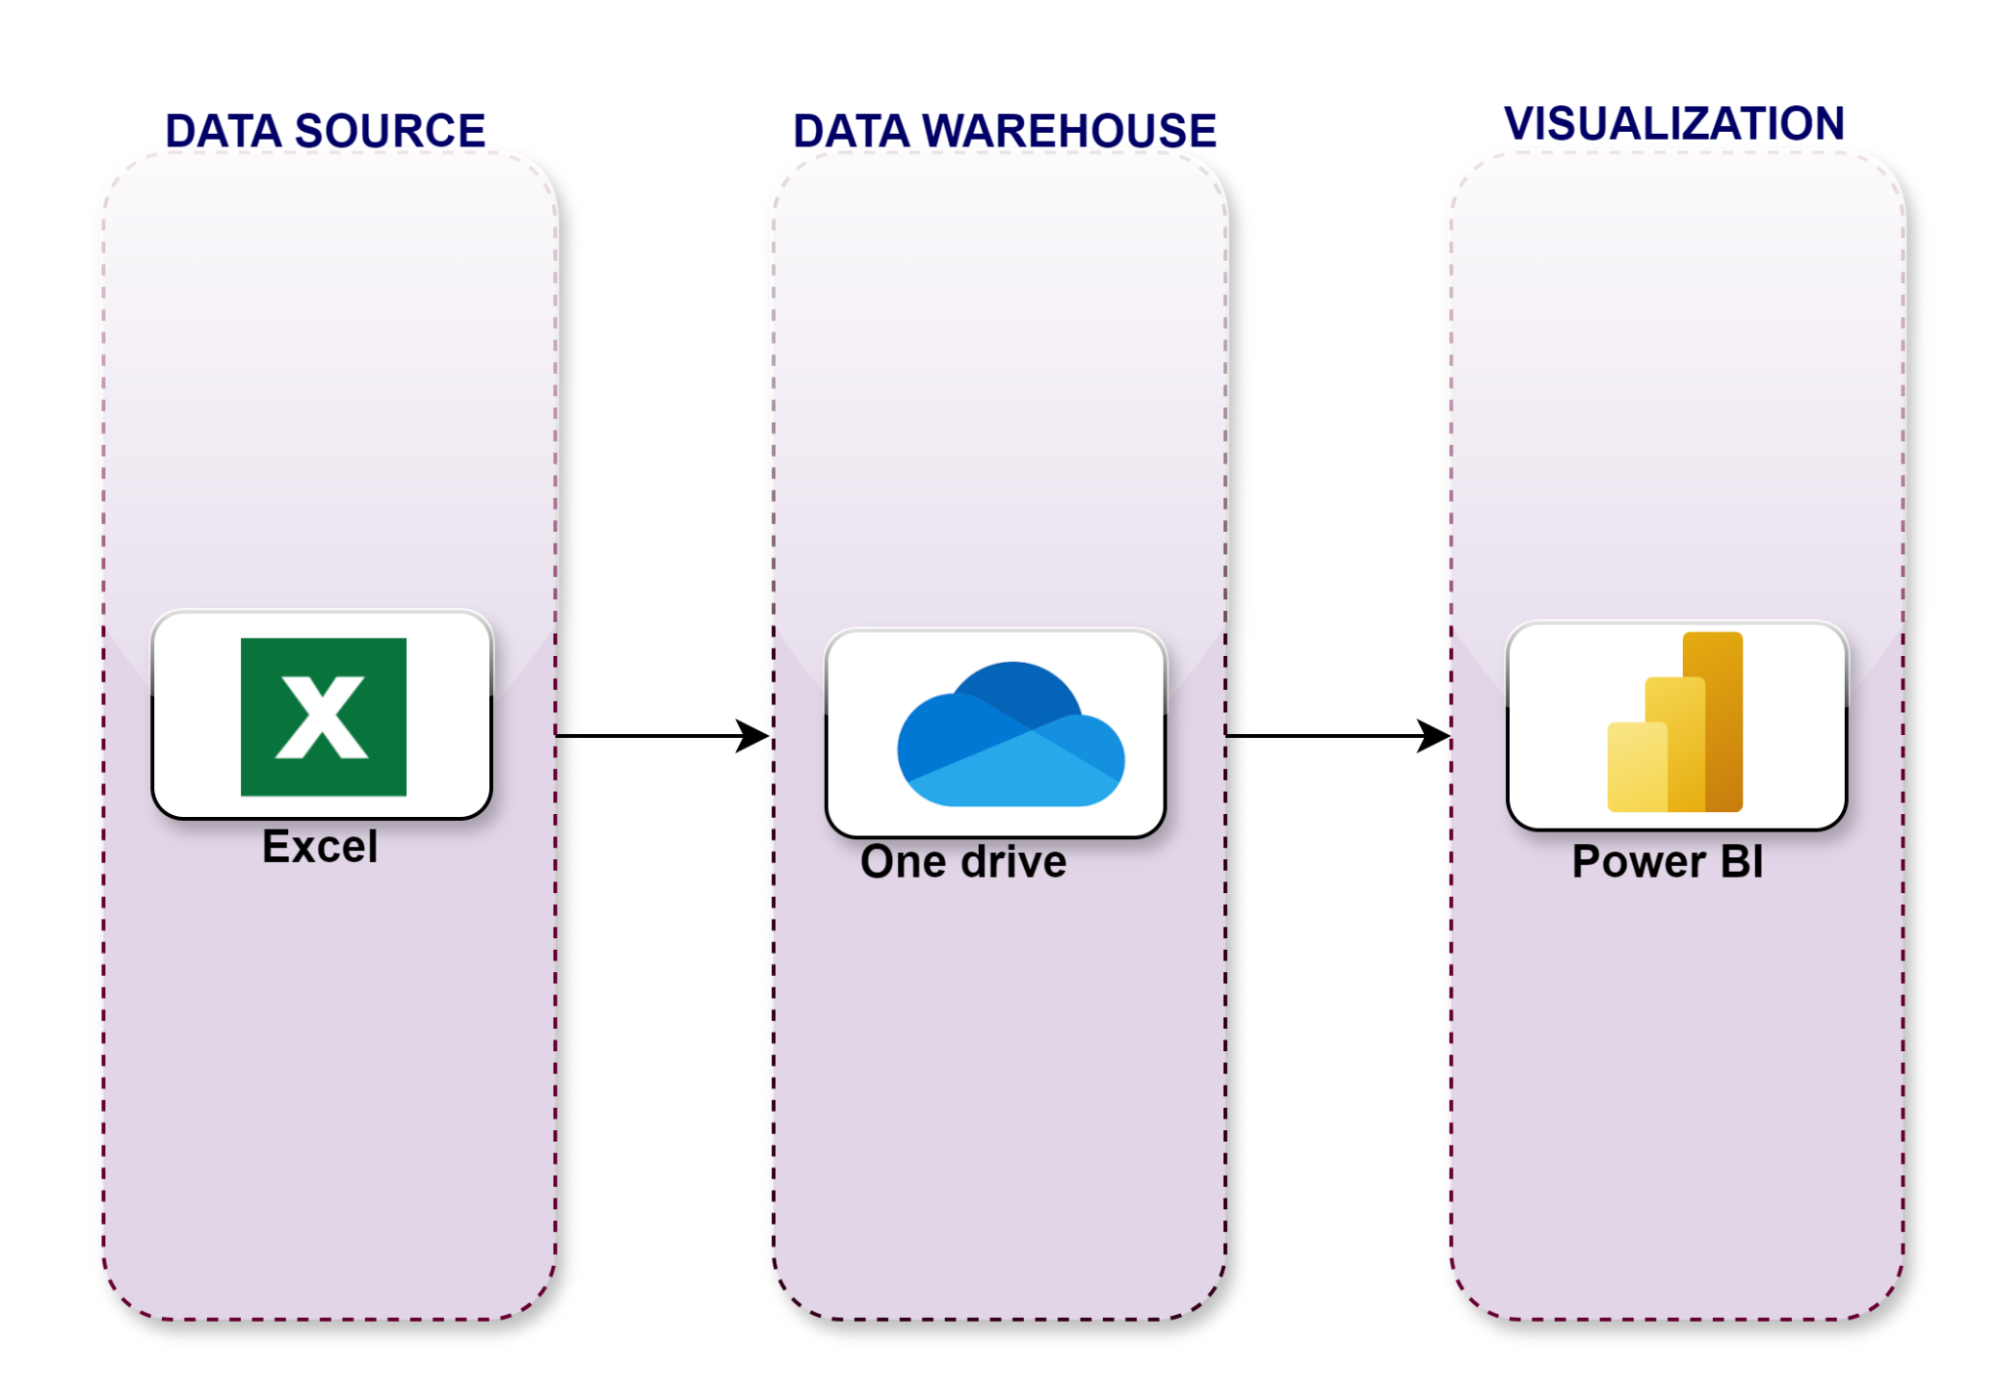
    Implementation 2:

    • Store Excel File on OneDrive:
      Data was uploaded to OneDrive to ensure easy accessibility.
    • Connect OneDrive to Power BI:
      Power BI was connected to OneDrive for real-time data updates.
    • Import Data into Power BI:
      The Excel data was imported for analysis in Power BI.
    • Refresh and Sync Data:
      Automatic refreshes ensured that data was always up to date in Power BI.
    • Create Dashboards in Power BI:
      Interactive dashboards were created to provide insights into customer behavior and market trends.

Business Impact

  • Secured $210,000 in additional funding from investors, showcasing the company’s enhanced market potential.
  • Increased customer segmentation accuracy, with a 40% broader demographic analysis, leading to a more focused marketing strategy and a 30% growth in targeted customer engagement.
  • Improved investor presentations with the created Power BI dashboard reducing the time needed to prepare presentations by 22 hours per month.
  • Reduced reliance on third-party tools, transitioning to comprehensive aggregated data, which resulted in a 50% improvement in decision-making speed and reduced errors in customer behavior analysis.
  • Trained the client’s team to use the data insights independently, which decreased external consultancy costs by $10,000 annually.

All-in-all, we addressed the client’s challenges in securing funding and gaining deeper insights into their customer base. The client successfully improved investor confidence and customer analysis by implementing robust data aggregation strategies and using Power BI for visualization. This initiative has provided them with the necessary tools to drive continued growth independently

Industry

Fashion

Services Used

Business Intelligence (BI), Data Analytics, Digital Transformation, Google Big Query, Power BI

Region

India

Function/Department

Customer Service and Support, Operations Management, Strategy and Planning

Engagement Model

End to End Project Lifecycle Management

DMCA.com Protection Status