For a modern-day business to flourish, data is proving to be an indispensable factor. It is now considered the new fuel for a company’s growth, making data scientists indispensable.
In an article published about a year ago, Forbes magazine talked about how data scientists ended up spending eighty percent of their time just preparing data.
After a schedule breakdown, it was concluded that the data scientist spent only one day a week on average, participating in the activities that truly improve profitability.
Not anymore though. Firms that have been using business intelligence for data handling and analysis have seen a constant growth of the firm while also observing better productivity for data analysts.
Tableau, one of the widely used BI tools has helped firms to gain efficiency and access to better insights for business. Considering the primary motive of any report is to enable stakeholders to make timely and accurate decisions, they must place their trust in the report creator.
If data is required to be extracted, prepped, and combined manually, it is bound to consume more time with enough room for manual error.
Tableau’s built-in features and preparation tools enable the user to collaborate and blend data while analyzing it in real-time.
Because it also requires creating data that can be understood by professionals with or without any technical knowledge, independent tableau services are bespoke in nature, for now.
But before we talk about Tableau and its use in 2022, let’s take a look at all you need to know about Tableau…

Tableau is a fast-growing data visualization tool that helps firms in making better decisions.
It helps in transforming raw data into an easily understandable format that can be understood by professionals of any level in the organization.
Users who are not very technologically sound can also create customized dashboards. This BI tool has gathered interest from users belonging to various sectors such as businesses, researchers, and academicians.
The major task of Tableau software is to connect and extract the data stored in various places. This data is used in creating interactive visuals.
Data visualization helps in better decision-making and the growth of the business. In a situation where data needs to be prepared and combined, it will require a lot of effort if done manually.
Tableau’s built-in data connections and tools enable a user to save up on time while boosting productivity.
This allows the analyst to focus on what their core objective is – analyze data and formulate insights.
To add to the benefits of using Tableau is the fact that it can easily handle a large amount of data.
Unlike Excel or other data-handling software, Tableau has no row limit and allows the user to bring in and analyze as many rows of data as needed.
Because Tableau is designed for scaling, overly-long processing times can be easily managed, giving the users a platform for more comprehensive visibility without consuming resource time.
This is also one of the reasons why tableau consultants suggest bigger firms use the tool, to save up on time, effort, and money.
When talking about a report, stakeholders may always go for questions like ‘what does this look like for the customer segment’ or if the trends in the past can be viewed to come to a decision.
Data analytics consulting companies who are required to provide tableau services to firms often come across such customers.
The reason for them to use Tableau is that it allows stakeholders to interact with and customize the dashboard within the parameters created by the user, in this case- Tableau consulting services.
Because of its popularity among a wide number of users, the Tableau community is full of passionate and knowledgeable people dedicated to making the most out of this BI tool.
While the competition between Tableau and other BI tools seems fierce, Tableau seems to have garnered the likes of the BI community altogether, for seven years in a row now.
Microsoft Excel is a spreadsheet and database tool that offers limited data analytics. Tableau is a proper business intelligence tool used for online analytics, querying, and reporting. It’s a data visualization tool where data analysts can present data in varying formats. The dashboards add/ edit data in real-time to provide the latest information to the analysts.
There are a lot more differences between MS Excel and Tableau. Let’s look at them in brief:
Excel is used for calculations and manipulating data using formulas. It was first released in 1987 and has various outdated and in-use versions available as a part of the Microsoft office package. Despite the latest updates, Excel is still limited in its usage when working with external data. It requires plug-ins to accept external data.
Tableau was released in 2003 and is data visualization software that focuses on the graphical and pictorial representation of data and analytics. Working with data from external sources is super easy with Tableau.
MS Excel requires at least a basic understanding of spreadsheets. The users should have technical knowledge and skills to work on advanced features and write custom formulas to analyze data.
Tableau is an easy-to-use software that requires little or no knowledge of complex formulas, etc. It is user-friendly and allows users to drag and drop the elements to the dashboard to make changes to the reports/ visualizations.
Excel cannot process big data. It is a straightforward tool limited to rows and columns. Tableau was created to overcome this challenge. It works with big data and can present the data in various formats.
While Excel is perfect for short-term use and limited data, Tableau is preferred to analyze big data and create visualizations in attractive formats.
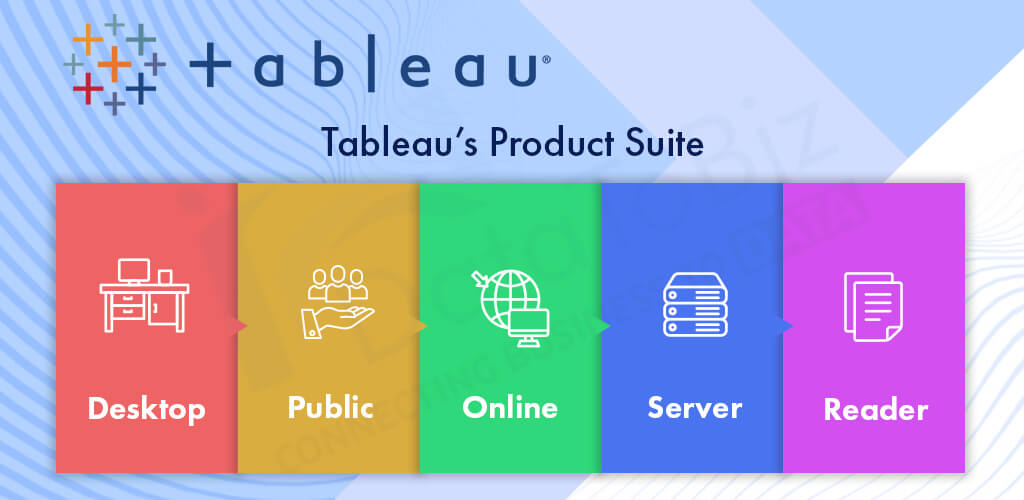
There are five major elements that make Tableau what it is. Tableau’s products always operate in a virtual environment when they are configured with proper underlying operating system and hardware.
Its star features like data blending, collaboration, and user-friendly approach are a result of these products being talked about…

Used to code and modify the reports, Tableau Desktop helps in creating reports and charts combining them all to form a dashboard.
Tableau Desktop is further classified into Personal and Professional categories to allow easy usage according to the connectivity available in the region.
In the Tableau Desktop Personal version, the workbook is in a private mode and access to it is limited. This implies that workbooks can’t be posted or shared anywhere and are available for personal use only.
Tableau Desktop Professional ensures that the file created only on Tableau Desktop is published on the Tableau server.
For firms or individuals who wish to keep their work private, Tableau Desktop is considered great.
A free desktop application that can be accessed for interaction in data visualizations built within Tableau Desktop. Tableau Reader is a tool that allows you the viewership of the workbook, and access to visualizations created using Tableau Desktop.
As the name goes, Tableau Online is an online sharing tool of Tableau. Its functionalities are similar to those of the Tableau server, with the difference being Tableau Online stores data hosted in a cloud environment, which is maintained by the Tableau group itself.
The storage limit on the data that can be published in Tableau Online is unlimited.
Talking of the similarities between Tableau Online and Tableau Server, both the products require workbooks created by Tableau Desktop to broadcast the data.
Also, data streamed from web-based applications such as Salesforce or Google Analytics are supported by both.
Specially built for cost-effective users, Tableau Public is saved on the public cloud which can be viewed by anyone. Workbooks cannot be saved locally and there is no privacy to the cloud since anyone can download and access it.
Tableau Public is the best for those individuals who want to learn Tableau and for the ones who want to allow the general public to access their data.
As a BI application, Tableau Server allows its users to organize, edit, share and collaborate on Tableau dashboards. The user can access updated content and gain quick insights without relying on external sources.
Tableau Server allows you to edit your stories, dashboards and workbooks while allowing you the authority to restrict access and the extent.
Tableau connects and extracts data that are stored at various places. It can pull data from any platform irrespective of availability.
A simple datasheet such as Excel, Pdf, to a complex database like Oracle, or Amazon web services can be extracted by Tableau.
When Tableau is launched, a set of ready data connectors are available which allows you to connect to any database.
Depending on which version of Tableau is available on the user’s system, the number of data connectors supported by Tableau will vary.
This data that has been extracted can either be connected live or directly moved to Tableau’s data engine, Tableau Desktop.
This is where the data analyst or the data engineer works with the extracted data to develop and create visualizations.
The dashboards that are created are shared with the users as a static file. The users who have access to view the dashboard may view the file using Tableau Reader.
The data from the Tableau Desktop can be easily published to the server. Since Tableau is an enterprise platform, collaboration, distribution, governance, security model, and automation features are well supported.
This results in providing the end-users a better experience in accessing the files from all locations irrespective of the system, device, or email.
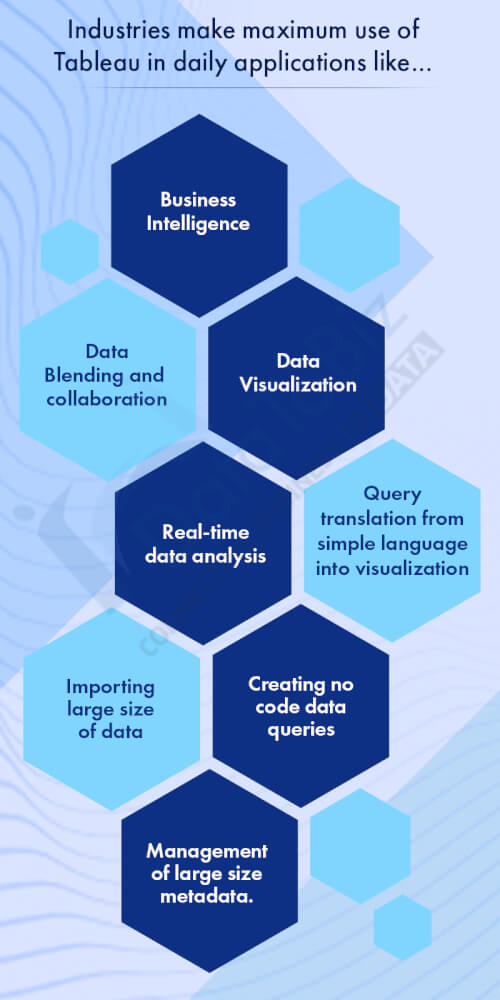
Key areas that make maximum use of Tableau in daily applications are…

– Business Intelligence
– Data Visualization
– Data Blending and collaboration
– Real-time data analysis
– Query translation from simple language into visualization
– Importing large size of data
– Creating no-code data queries
– Management of large-size metadata.
Before we talk about why tableau consultants vouch for the tool over any other data handling software, let’s understand how Tableau is positioned against the commonly-used Excel.
While both Excel and Tableau are data analysis tools, they have their own unique way of data exploration.
Excel allows working on a spreadsheet with rows and columns, whereas Tableau explores data using its drag-and-drop feature for almost all functionings.
Tableau gives you insights through interactive visualizations by deploying data digging tools. With Excel or other data-handling tools, the user is required to represent data into a tabular format and then apply visualizations to it.
Tableau is an easy approach wherein only basic prior knowledge to use the tool is required. However, to use Excel the user must understand the functionality of all the icons to work with various formulae.

Talking of the benefits of Tableau for those firms who look forward to boosting productivity are…
Tableau allows you to work with a large amount of data that is unorganized, doesn’t have any particular order to it, and creates a wide range of visualizations.
When working in a cross-functional team, firms may use the option of switching between different visualizations to show a greater context involving results from all the teams.
Tableau can help enterprises to analyse data without any specific goal in mind. The user has the option to explore visualizations and look at them from different perspectives.
When working with real-time data, these capabilities matter a great deal, especially when mentioning a hypothetical situation.
We have mentioned it before and we talk about it again, being user-friendly is one of the biggest benefits offered by Tableau. Everything that is required in data visualization can be done with this tool, without having the need to learn all about it.
Since most of Tableau’s features are in a drag-and-drop format, each visualization is so intuitive and self-depicting.
Tableau has a powerful reason for being the first choice in modern organizations. In a data-driven age, data can come from any point and any source.
Tableau has an edge over other BI and analytics tools, as it lets you work by connecting to various data sources and blends with different types of data.
This helps organizations to use compelling visualizations for analysis.
All SQL operations can be easily performed with Tableau, to create useful KPIs. Business users make the most of Tableau with this very advantage.
Are there any challenges in implementing business intelligence?
BI requires a roadmap, a strategy, and resources for successful implementation and scaling in an organization. Business intelligence systems might take several months before they show measurable ROI, as are any enterprise systems. Organizations that successfully use BI to improve profits and reduce operating costs pledge a long-term commitment to building a data culture.
To summarize, Tableau can help anyone organize and understand their data.
As a firm you can connect to any database, blend and collaborate on large sets of data, to create interactive and compelling visualizations.
It holds a revolutionary approach to business intelligence, allowing users to create and publish customized dashboards, and share them with colleagues or publicly, depending on choice.

1 Comment