Business intelligence reporting provides the enterprise with the latest information about the overall performance of the business. We’ll discuss the need for BI in today’s scenario and the types of reports an organization can generate using BI tools.
In today’s digital world, technology is a must-use in every business, big or small. Companies should sustain market competition using advanced technologies like business intelligence, artificial intelligence, data science, etc.
It’s no surprise that business intelligence is being widely adopted across all industries. Statistics show that using analytics can increase the decision-making speed by 5x times. 67% of businesses already have access to BI tools. According to the reports, cloud BI is the fastest growing market around the world. Among the regions with the highest adoption rates is Asia Pacific. Countries like India, China, and Japan use BI, AI, IoT, etc., to streamline business operations.
Many enterprises hire business intelligence consultants to integrate BI into their existing systems and processes. This ensures they have access to expertise and minimize the risk of failure. Setting up BI tools requires an in-depth understanding of the business and the necessary technologies to achieve the goals.
In this post, we’ll discuss business intelligence reporting in detail and look at the types of BI reports to use in an establishment. We’ll also get a brief glimpse into the leading BI tools used in the global market.
Business intelligence is a collection of tools, technologies, strategies, applications, and practices that collect, format, store, process, and analyze data from internal and external sources. BI gives intelligence reports (data analytics) that help establishments make better decisions.
BI provides a business with actionable insights using historical and real-time data. These insights give a micro and macro view of the business performance, thus helping employees and the top management with decision-making. BI can be used in any department, such as HR, finance, sales and marketing, production, quality control, inventory management, customer service, etc.
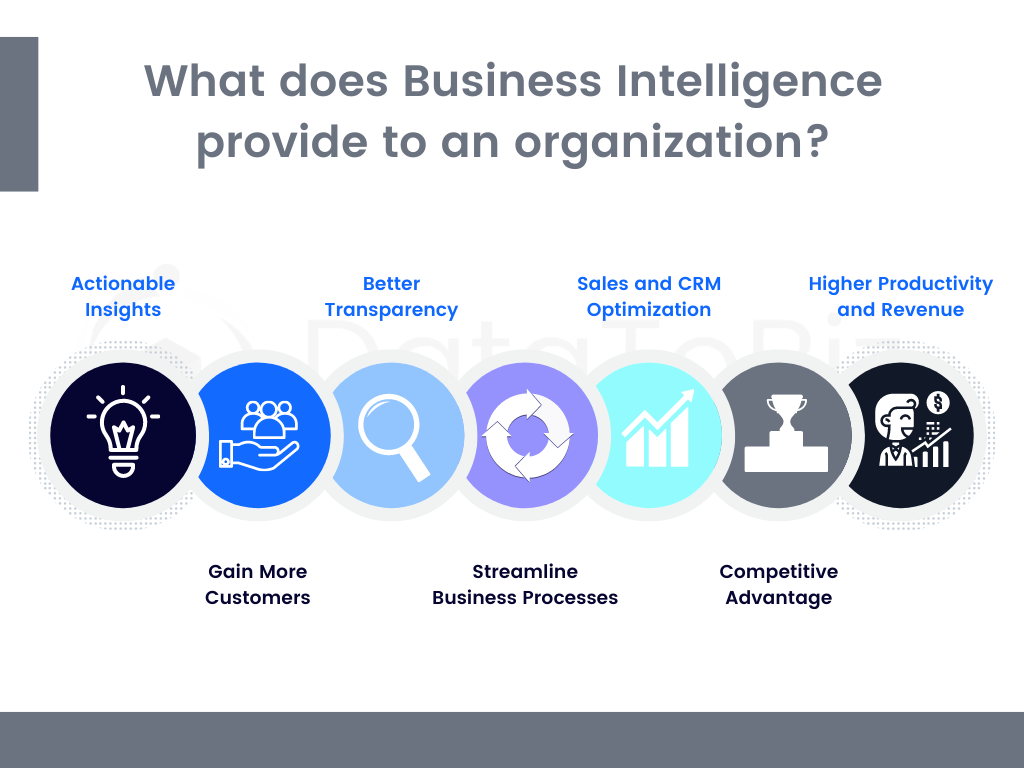
Business intelligence is important as it provides the following to an organization:

It’s vital to make business decisions based on solid insights. BI provides these insights by processing vast amounts of information in a quick time. A business doesn’t have to rely on guesswork or past trends to make present and future-related decisions.
The ultimate success of a business lies in how many customers it can attract and retain. BI reports provide details on where and how the enterprise can improve to gain more customers. From analyzing the target market to audience segmentation and understanding customer feedback, BI helps streamline the process.
Maintaining transparency in the internal systems and processes gives the top management and employees more control. It helps standardize the procedures and reduces the time taken to read through pages of complex data. BI reports make it easy to identify areas for improvement. Business intelligence empowers the enterprise to become proactive instead of reactive.
Are there business procedures that aren’t delivering the expected results? Does the enterprise use legacy systems and spend more money/ resources on running the business? BI reports will provide answers to these questions and more. The top management can streamline the internal processes to optimize the use of resources.
Sales, marketing, and customer relationship management continue to be primary areas where business intelligence reports are used. Track customers (their purchases, likes, preferences, etc.), market trends (to manage demand and supply), and effectively predict/ forecast sales using BI tools.
The top management of a business should always be aware of the competitors and the changing market conditions. It is vital to stand out from the rest and increase business credibility and awareness to attract more customers. BI gives the organization a competitive edge against businesses with no BI. The accuracy of the insights will further strengthen the market position of the enterprise.
Business intelligence reports give a clear picture of the strengths and weaknesses of the enterprise. This data is presented in an understandable format and forms the basis for strategic changes to the systems and processes. The management can optimize resources, invest in advanced technologies, train employees, and create a comprehensive plan to improve productivity. This, in turn, increases revenue and brings profits over time.

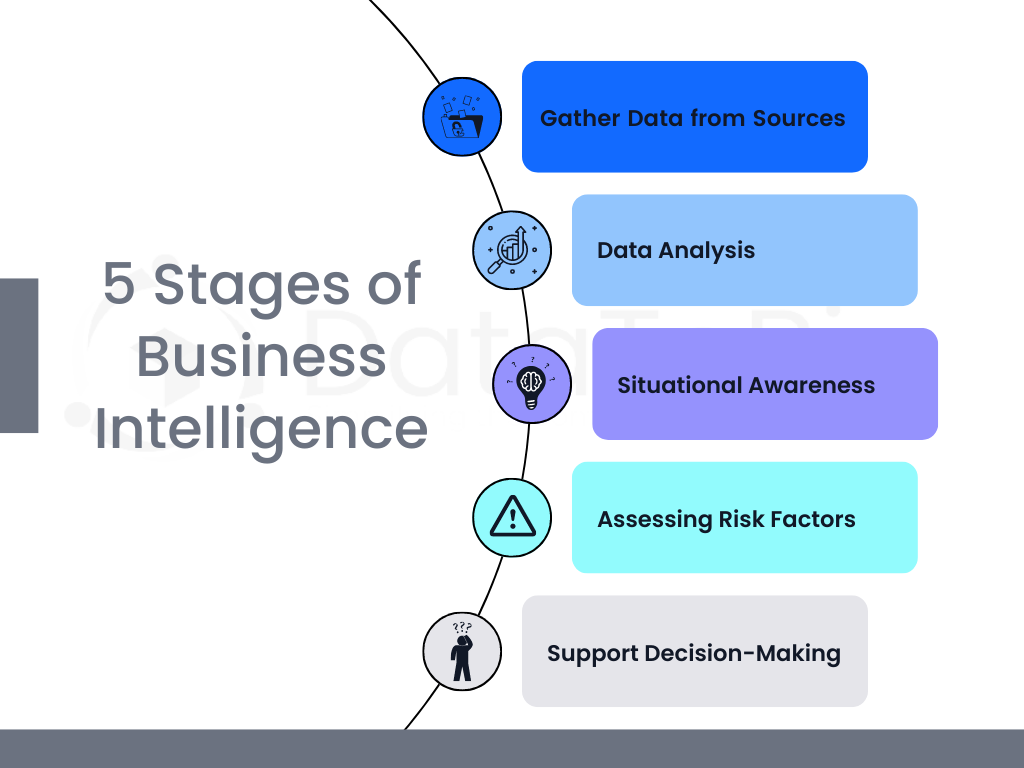
The core purpose of business intelligence is to transform raw data into analytics and understandable reports. BI can be divided into five stages listed below.
The first step is to gather data from multiple external and internal sources. This is raw data that will be cleaned, structured, formatted, and processed. The data is stored in a centralized database on the premises or cloud.
The second stage is where the collected data is synthesized to gather useful knowledge. The data is then analyzed to derive actionable insights and predict future trends. Various models are used to understand the data and fill the gaps. This stage of data analysis is also termed data mining.
The next step is where unwanted information is filtered. Only the relevant information is used for analytics. This is also known as situational awareness (where the system knows which data is necessary for decision-making). The algorithms are developed to automatically filter information and derive insights.
BI is crucial in assessing risk and minimizing losses for the business. It gives the best possible ways to handle a situation and make the most of the market conditions. Furthermore, it gives a clear picture of the advantages/ disadvantages of choosing one action over the other.
The biggest role of business intelligence is to help with day-to-day and long-term decision-making. This is the final stage where mid-level and top management uses BI reports to determine when to release a new product, take over other businesses, etc.

BI works when there is data to process. But how can an enterprise gather vast amounts of data for analytics? Let’s find out.
This method covers historical data. It focuses on pain points and aims to find a solution to make things better. However, a limited number of users are involved in this method.
This method deals with the current/ present situation in the business. What do the employees/ management want from the business at this point? It is an operational method that ends once the need is fulfilled.
This method deals with future requirements. It considers the long-term goals of the business and how these can be achieved. That said, the goals need to be realistic.
A few other methods to gather data for BI are:
Reporting is the process of presenting the collected information in an easy-to-understand format. Reporting in BI makes the data interactive and allows employees to get real-time insights with a couple of clicks. The biggest advantage of BI reporting is that it provides qualitative data rather than quantitative data. The reports are created and shared through BI dashboards. The dashboards can be customized for each department and vertical in an enterprise.
BI reporting is used for the following purposes:
Business intelligence reports can be categorized into different types. The broad classification has the following:
These are standard business reports (query reports, data entry reports, etc.) used by every business. General reports are used in departments to make short-term and long-term decisions related to the department and employees.
These reports contain a compilation of various business modules. In most instances, the modules are independent. Aggregate reports are used to assess business performance, compare the progress with KPIs, and for top-level decision-making.
Dashboard reports are a favorite in many enterprises. These are customized to suit the employee/ job requirements. The dashboards are interactive and can be edited in real time to get more insights. Dashboard reports provide trends, threats, opportunities, risks, and other information to make day-to-day decisions. These can be further classified into:
It monitors real-time data for everyday work and decision-making.
It is used by top-level executives to stay up to date about goals, profits, revenue, etc.
It is used by business analysts to track patterns, trends, outcomes, and more to stay ahead of competitors.
Business intelligence reporting can be as detailed as the business wants it to be. An organization can create different types of reports based on what they want from BI. Business intelligence experts will set up dashboards and metrics to generate reports in real-time.
The Key Performance Indicators (KPIs) are varied and diverse. They are used to measure the overall performance of the business. These reports give the management an in-depth insight into whether the enterprise is on the right track to achieve its goals and what changes can be made to improve the overall performance.
Every department has its own KPIs and metrics. For example, the functions of the HR department are different from what the finance department does. The metrics are determined based on the core functions of the department and individual reports are set up to deliver the necessary insights as and when necessary.
These reports give the HR department and the top management a clear picture of how employees are handling their jobs. The reports give insights into customer satisfaction, business productivity, and more. The management can also know if employees are satisfied at work.
Interactive reports are also called data visualizations. Such a report can present historical and real-time data on the same screen. Employees can click on the individual elements of the report to gather more information about the factor or see how it changes in relation to another.
Embedded reports are shared with employees, stakeholders, suppliers, clients, etc. The reports provide the necessary information in a graphical format and enable faster decisions. The data for these reports is stored in data warehouses or data lakes (cloud). Businesses can also offer B2B services using embedded reports.
As the name goes, these reports are used to share future predictions, possibilities, and opportunities to make strategic decisions and boost the business. Predictive analytics is mainly used in the sales and marketing department to provide customers with what they want and increase revenue.
BI is no longer limited to desktop computers. Employees can get the analytics on their mobile phones using BI tools like Power BI, Tableau, etc. This allows them to work on the go and stay updated at all times.
There are several BI reporting tools in the market. Microsoft Power BI continues to be at the top, followed by Tableau. According to TrustRadius, Power BI was the most compared software in 2021. It had a market share of 36%, while Tableau had 20%.
Let’s look at the top six recommended BI reporting tools to use in your enterprise.
It is best for built-in reporting, customization, and data visualization. It offers multiple price plans and is suitable for small to large businesses.
It is suitable for small businesses and comes with affordable pricing. It offers third-party integration and mobile intelligence.
It is user-friendly and can be customized. It supports third-party integrations and has varied pricing to suit different businesses.
It is a hybrid BI tool that offers API integration and white-label services. You can conveniently set it up and use it and comes with custom pricing.
It offers super easy reports with data-rich analytics. The company also provides a free training course. It allows third-party database integration.
It offers full-scale analytics and is suitable for complex querying. In addition to being on-premises, it can also be used in the cloud. It allows third-party integrations.

BI will continue to be vital for every enterprise. Trends show that more organizations will invest in integrating BI with their systems. Business intelligence consulting services are in high demand in the global market as it is a cost-effective and less risky method of using BI in an enterprise.
The solutions are customized for each establishment based on the business goals and targets. It’s time to make BI an integral part of the organization and reap the benefits of using data-driven insights to make more informed decisions.
