Data-Driven Transformation of Indian Textile Production Operations
About Client
One of India’s fastest-growing manufacturing companies with an annual capacity of 25 million towel pieces and a turnover of $45 million.
Producing 8,000 metric tons of towels, their operations are vertically integrated, ensuring quality from fabric spinning to processing. Backed by in-house R&D and sustainable practices, they continuously innovate their linen and towel product offerings while prioritizing staff development.
Problem STATEMENT
When sat for the first round of discussion, the client highlighted their struggles with monitoring and analyzing user engagement, marketing performance, and audience growth due to fragmented data spread across platforms like LinkedIn, ConvertKit, and Google Analytics. Key issues identified were:
Tracking Machine Performance and Material Flow
Difficulty in identifying which machines were processing specific inputs and what outputs were being generated.
Inefficient monitoring of raw material usage and outputs at different stages of production.
Monitoring Wastage and Production Timelines
Limited visibility into material wastage across production lines, resulting in resource inefficiencies.
Inability to accurately track the time required for products to move between production stages, causing delays and bottlenecks.
Solution
The project involved addressing the client’s challenges by introducing a system to monitor machine performance, material flow, and production timelines. Key implementations done were:
Machine and Material Tracking Implemented a system to monitor machine utilization, track inputs and outputs, and identify inefficiencies or underperforming machines across all production stages.
Wastage Monitoring and Reduction Introduced tools to track material losses at each stage, enabling the client to identify patterns and implement waste reduction strategies.
Production Timeline Tracking Captured detailed time metrics for product movement across stages to detect bottlenecks and improve workflow efficiency.
Power BI Dashboards Designed interactive dashboards that visualized KPIs like production efficiency, wastage rates, and lead times, ensuring stakeholders had easy access to actionable data.
Continuous Improvement Framework Leveraged data-driven insights to refine operations, ensuring the client could maintain a cycle of ongoing process optimization.
Technical Implementation
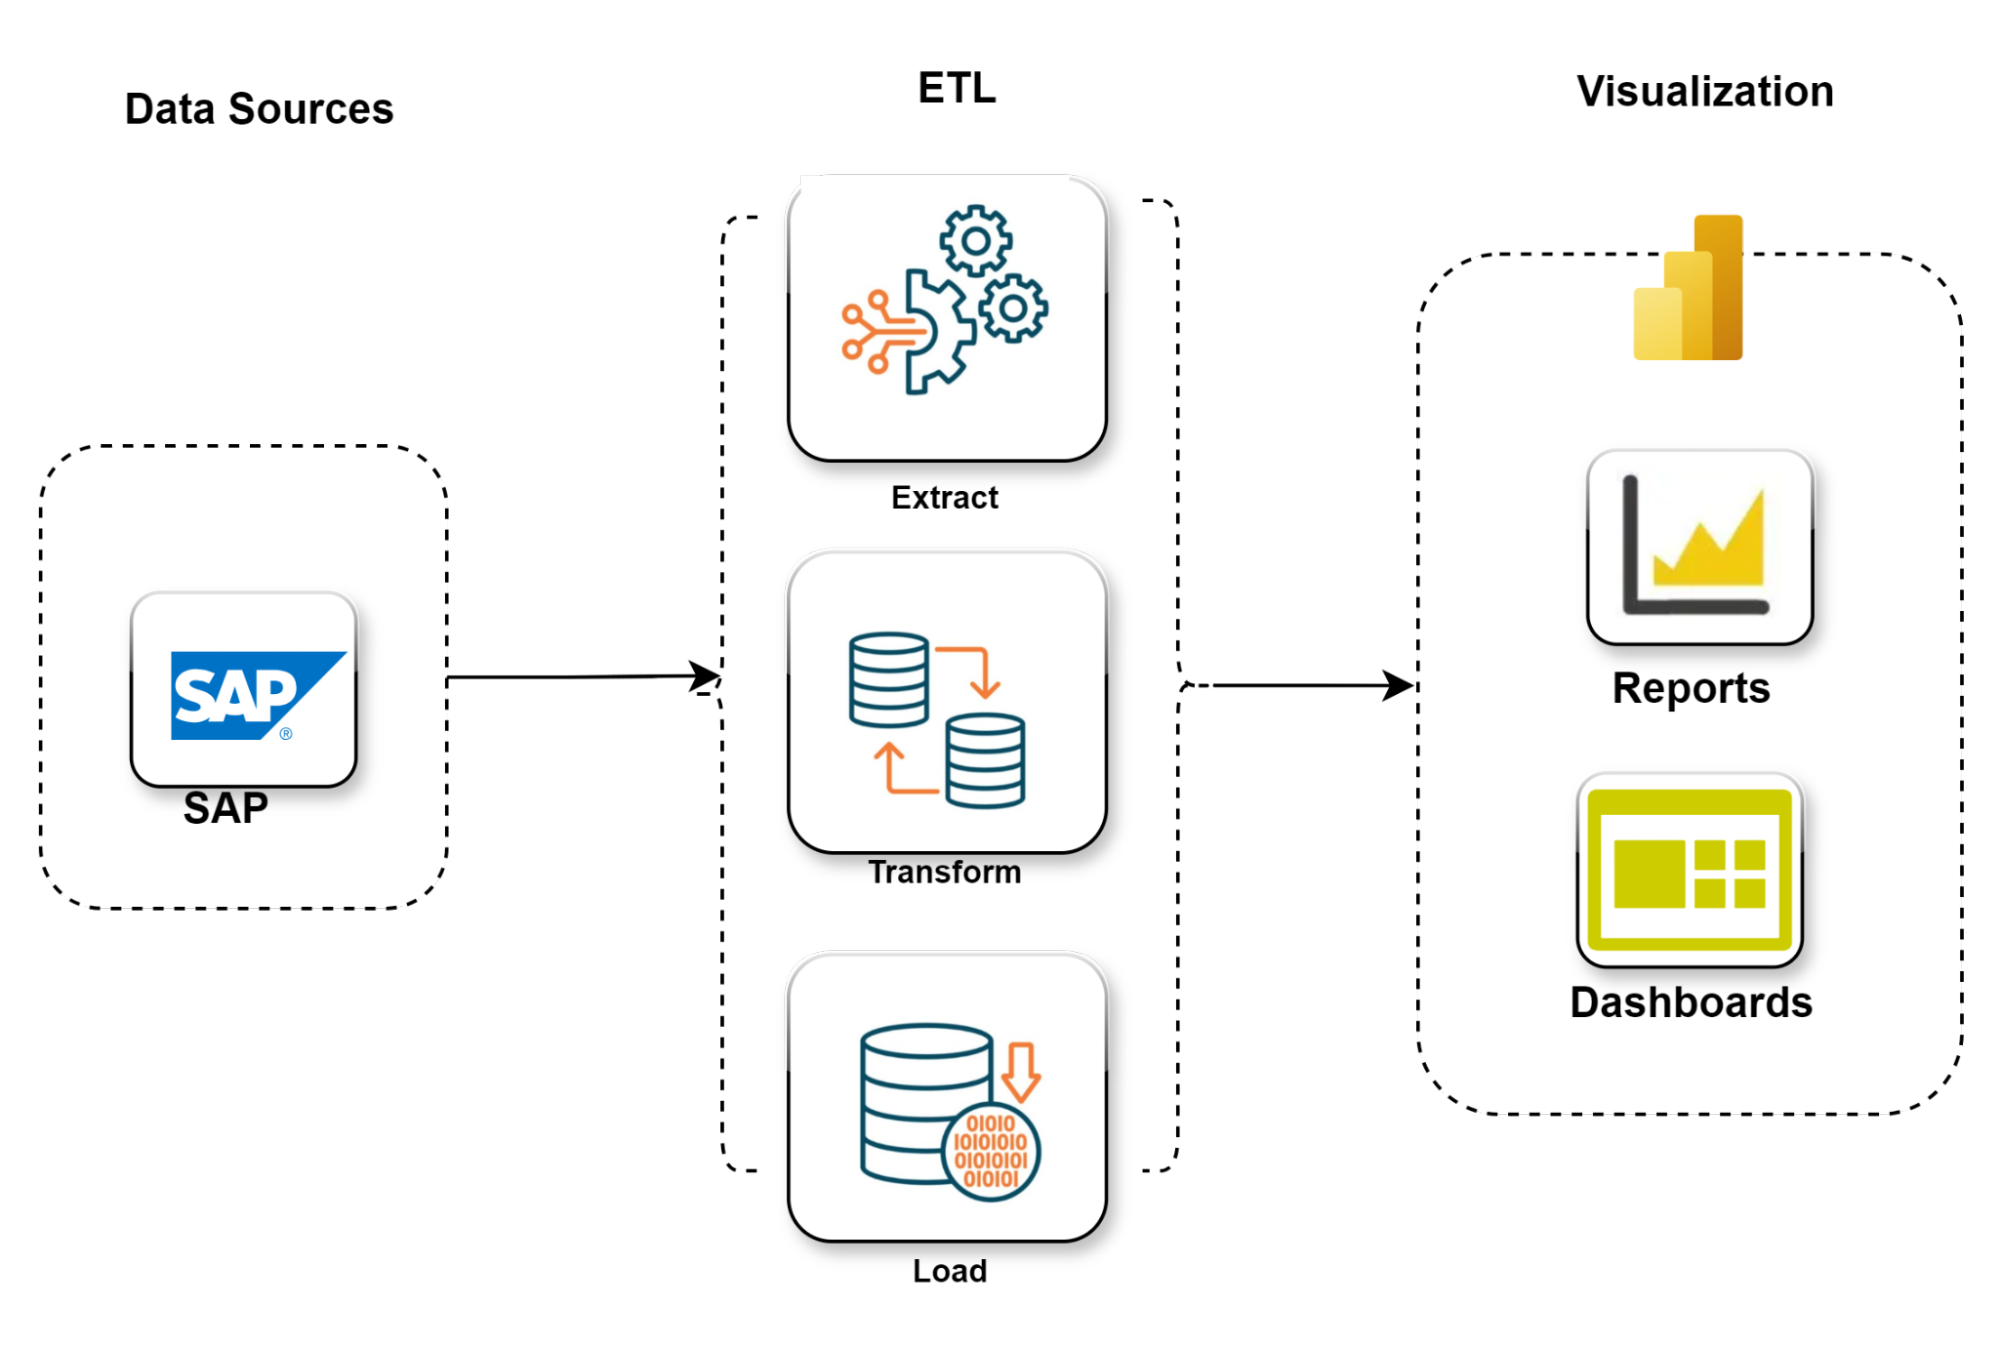
Data Extraction
Pulled production data (inputs, outputs, utilization, wastage, and timelines) directly from the SAP system.
ETL Process
Extract: Retrieved raw data from SAP for all production stages.
Transform: Cleaned, filtered, and standardized data to align with reporting requirements, calculating KPIs like efficiency and wastage rates.
Load: Stored processed data in a centralized data warehouse for streamlined access and reporting.
Power BI Integration
Connected Power BI to the ETL pipeline for real-time visualization of structured data.
Developed user-friendly dashboards with KPIs, charts, and trends to enable quick insights.
Security and Access Control
Established user roles and permissions in Power BI, ensuring secure access to sensitive production data.
Business Impact
Enhanced Machine Utilization
Increased machine utilization by 15% by identifying and addressing bottlenecks.
Waste Reduction
Reduced material wastage by 20% through targeted monitoring and resource optimization.
Improved Workflow Efficiency
Shortened lead times between stages by 10–12%, ensuring smoother operations and on-time deliveries.
Complete Visibility into Metrics
Power BI dashboards provided comprehensive insights into production metrics, enabling proactive management and faster issue resolution.
Automation and Alerts
Achieved a 30% reduction in downtime by implementing automated alerts for delays or underperforming equipment.
Sustained Operational Improvement
Data-driven insights contributed to a 15–18% improvement in overall production efficiency.
All in all, the introduction of a robust monitoring and reporting framework transformed the client’s production operations. By integrating SAP data extraction with an efficient ETL pipeline and visualizing key metrics through Power BI, the client gained clear insights into machine performance, material flow, and production timelines. This led to significant efficiency gains, reduced waste, and faster production cycles.
Industry
Manufacturing & Industrial Engineering
Services Used
Business Intelligence (BI),Data Analytics,Digital Transformation,Power BI,SAP Integration with PowerBI
Region
India
Function/Department
Accounting and Finance,Manufacturing & Production,Marketing and Branding,Supply Chain Management
Engagement Model
End to End Project Lifecycle Management
Drop Your Business Concern
Briefly describe the challenges you’re facing, and we’ll offer relevant insights, resources, or a quote.
Ankush
Business Development Head
Discussing Tailored Business Solutions